We've all seen this type of diagrams, right?
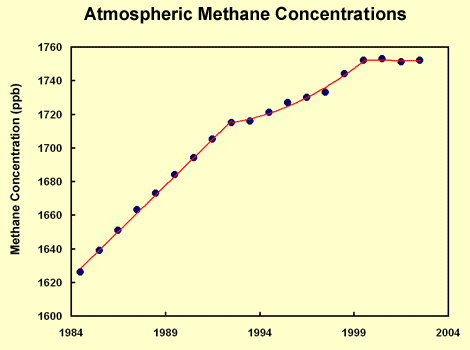
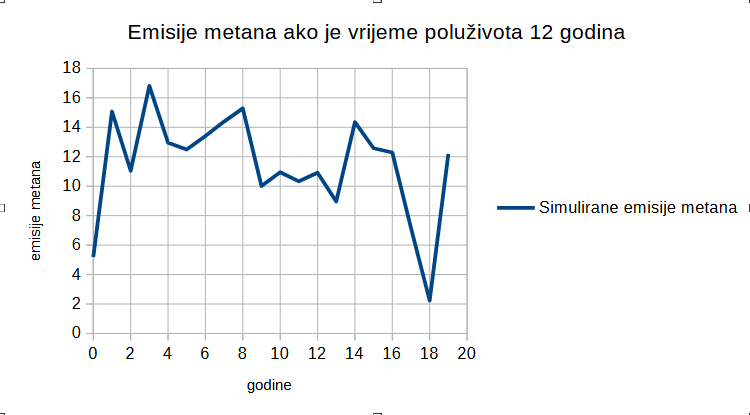
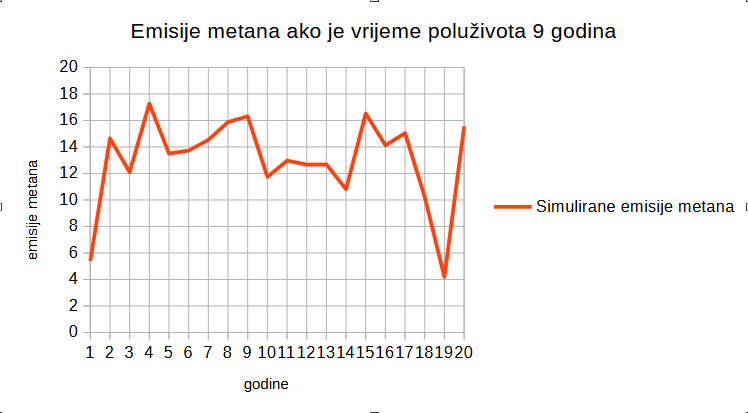
The argument goes that our methane emissions must be approximately equal to the derivative of that curve, slightly larger than that because methane in the atmosphere has a half-life of 12 years (that it would equal to the derivative if the half-life was infinite, but actually it is slightly larger than that). So it is visible from the diagram that our methane emissions reached their peak somewhen in 1980s and have been decreasing ever since. Makes sense, right? Well, according to this new argument I found, that's actually not the right inference, but the right inference is that our methane emissions have been approximately constant. That would be the right inference if methane in the atmosphere were a IT1-type system, but it actually isn't.
To understand why, try to derive the transfer function. Now, it might not be obvious how to derive the transfer function directly (or even how to set up the differential equations), but ask yourself: What is the impulse response (the response to the Dirac delta function)? It seems obvious that it is approximately:
g(t)=e^(ln(2)/12*t)
And since for linear time-invariant systems (which methane in the atmosphere approximately is) the transfer function is equal to the Laplace transform of the impulse response, that means the transfer function has to be:
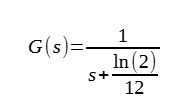
So, what is its step-response? How would a system described by that transfer function respond to constant methane emissions? Well, type this into Octave or MatLab:
Code: Select all
pkg load control;
s=tf('s');
step(1/(s+log(2)/12))

Which looks like the diagram of methane concentration in the atmosphere over time.
Does this curve converge or does it go to infinity. Well, that be determined using the final value theorem of the Laplace transform. The Laplace transform of the step response is, of course:
S(s)=1/s*G(s)
And the limit of the step response as time approaches infinity is, by the final value theorem:
lim(t -> inf, s(t))=lim(s->0,s*S(t))=12/ln(2)
So, given that, according to the diagram, the amount of methane in the atmosphere rose from 1620 to 1760. Therefore, our methane emissions are:
(1760-1620)/(12/ln(2))=8.0867
And they are constant.
What do you think is wrong with that argument?
I e-mailed my Control Engineering professor [redacted] about it to see what he thinks.